Terrakube components support Open Telemetry by default to enable effective observability.
To enable telemetry inside the Terrakube components please add the following environment variable:
Terrakube API, Registry and Executor support the setup for now from version 2.12.0.
UI support will be added in the future.
Once the open telemetry agent is enable we can use other environment variables to setup the monitoring for our application for example to enable jaeger we could add the following using addtional environment variables:
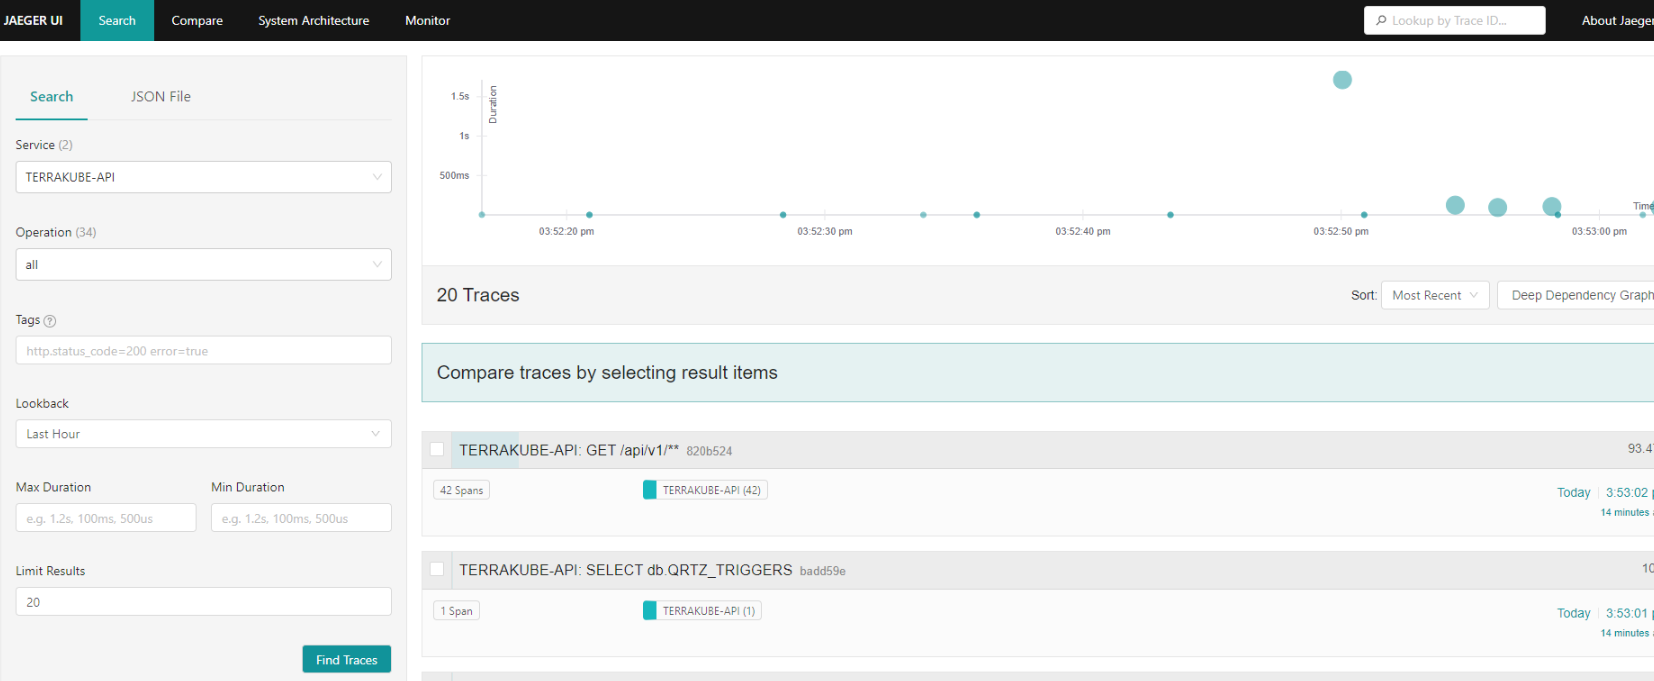
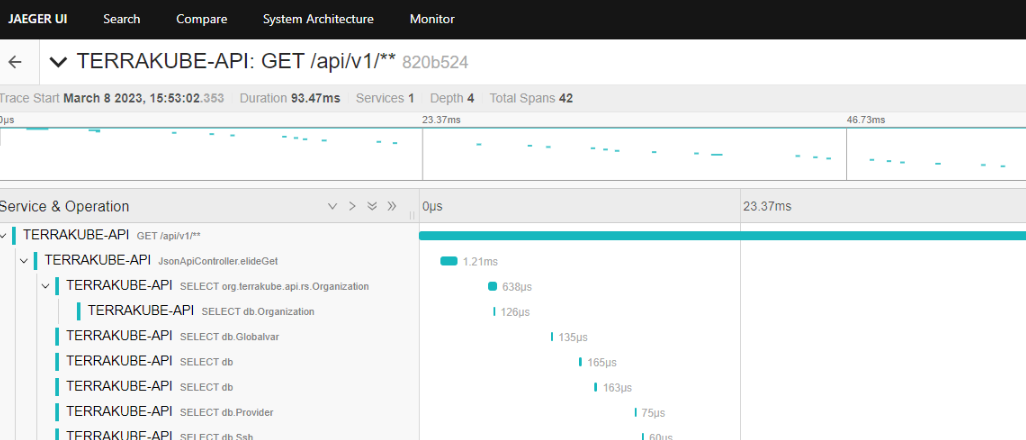
Now we can go the jaeger ui to see if everything is working as expected.
There are several differente configuration options for example:
The Jaeger exporter. This exporter uses gRPC for its communications protocol.
System property | Environment variable | Description |
---|---|---|
otel.traces.exporter=jaeger | OTEL_TRACES_EXPORTER=jaeger | Select the Jaeger exporter |
otel.exporter.jaeger.endpoint | OTEL_EXPORTER_JAEGER_ENDPOINT | The Jaeger gRPC endpoint to connect to. Default is |
otel.exporter.jaeger.timeout | OTEL_EXPORTER_JAEGER_TIMEOUT | The maximum waiting time, in milliseconds, allowed to send each batch. Default is |
The Zipkin exporter. It sends JSON in Zipkin format to a specified HTTP URL.
System property | Environment variable | Description |
---|---|---|
otel.traces.exporter=zipkin | OTEL_TRACES_EXPORTER=zipkin | Select the Zipkin exporter |
otel.exporter.zipkin.endpoint | OTEL_EXPORTER_ZIPKIN_ENDPOINT | The Zipkin endpoint to connect to. Default is |
The Prometheus exporter.
System property | Environment variable | Description |
---|---|---|
otel.metrics.exporter=prometheus | OTEL_METRICS_EXPORTER=prometheus | Select the Prometheus exporter |
otel.exporter.prometheus.port | OTEL_EXPORTER_PROMETHEUS_PORT | The local port used to bind the prometheus metric server. Default is |
otel.exporter.prometheus.host | OTEL_EXPORTER_PROMETHEUS_HOST | The local address used to bind the prometheus metric server. Default is |
For more information please check, the official open telemetry documentation.
Open Telemetry Example
One small example to show how to use open telemetry with docker compose can be found in the following URL: